X Launches Updated Post Analytics Display: Everything You Need to Know
Have you ever wondered if your posts on X (formerly Twitter) are making the impact you hoped for? As of May 15, 2025, this question has become much easier to answer. X has rolled out its highly anticipated updated post analytics display, giving content creators unprecedented insights into their performance metrics. Whether you’re a social media manager, influencer, or business owner, these new analytics tools can transform how you understand and optimize your content strategy.
Key Features of X’s Updated Post Analytics Display
The refreshed post analytics display comes packed with features designed to give you deeper insights into your content performance. At its core, the update introduces a more visually intuitive dashboard where metrics are organized by impact categories rather than simple chronological lists. This means you can now instantly see which content drives engagement versus which posts generate conversions or expand your audience.
SOURCE : Social Media Today
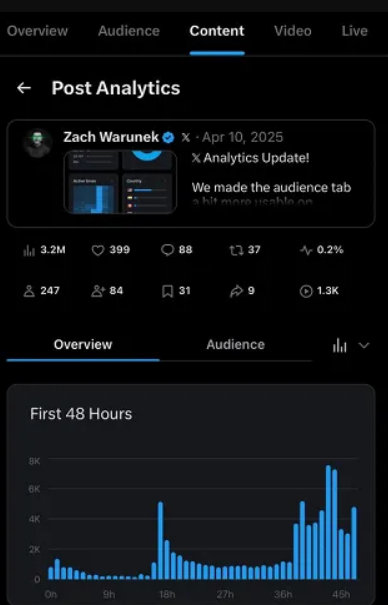
Another standout feature is real-time performance tracking, allowing you to monitor how your posts perform minute-by-minute after publishing. This is particularly valuable for time-sensitive content or when riding trending topics. The updated display also introduces audience segmentation analytics, breaking down your engagement by demographic factors, including location, age range, and interest categories.
Metrics You Can Track With the New Analytics Display
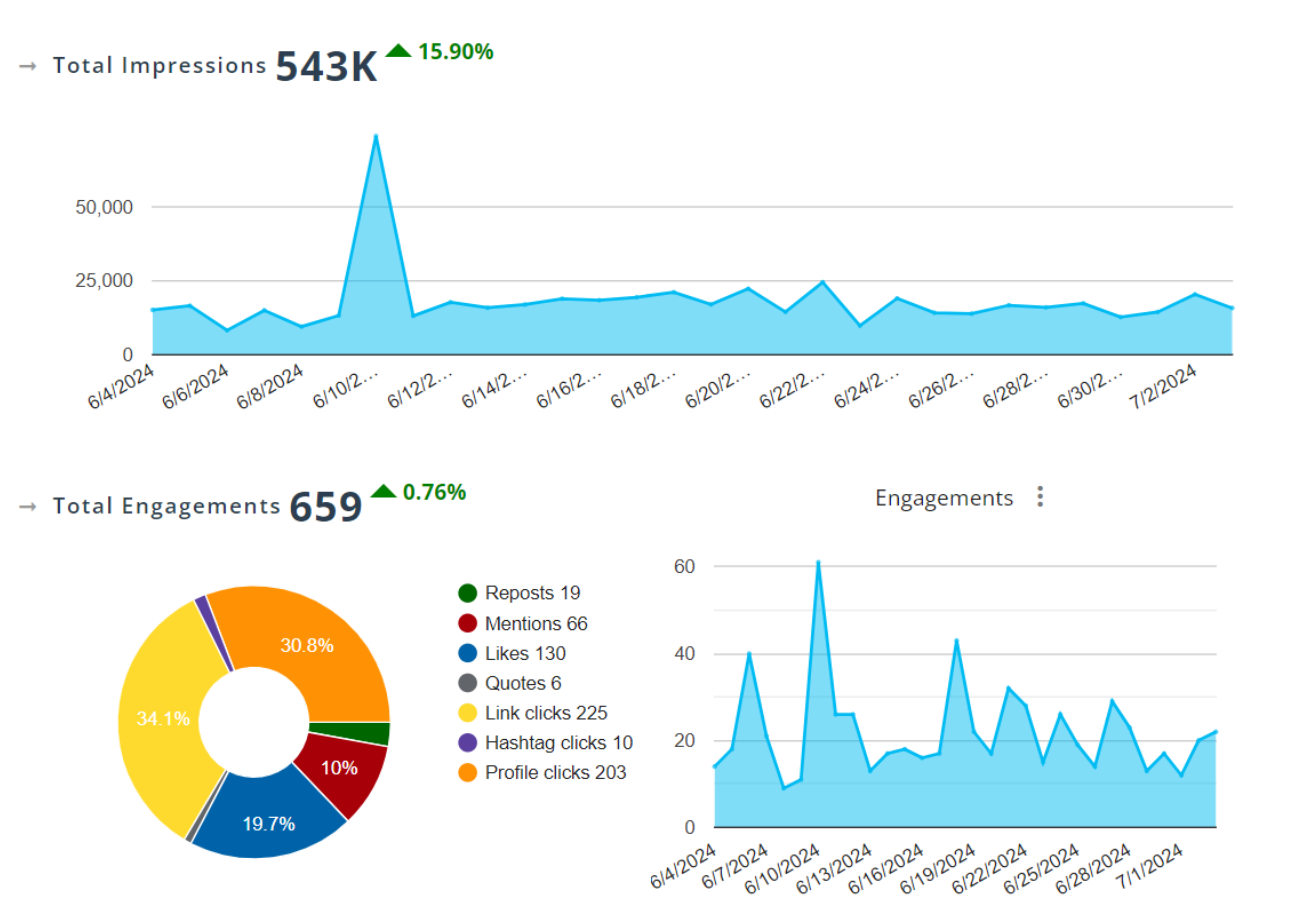
The updated post analytics display significantly expands the metrics available to users. Beyond basic impressions and engagement rates, you can now track:
- Engagement depth – Not just how many people engaged, but how meaningfully they interacted
- Audience retention – How long viewers spent consuming your content
- Conversion tracking – Direct correlation between posts and link clicks, profile visits, or follows
- Content virality potential – Predictive scoring based on initial engagement patterns
- Competitive benchmarking – How your content performs against similar accounts in your niche
How the Updated Analytics Improves Your Content Strategy
With X’s updated post analytics display, creating a data-driven content strategy becomes significantly more accessible. The new correlation analysis feature automatically identifies patterns between your highest-performing posts, suggesting what content elements resonate most with your audience. This means less guesswork and more confidence in your content decisions.
SOURCE : Fedica

SOURCE : Fedica
The custom report builder allows you to focus on metrics that matter most to your specific goals. For instance, if you’re driving traffic to a website, you can create dedicated reports tracking click-through rates and subsequent conversion actions. The system even suggests optimal posting times based on when your specific audience is most active and engaged.
Key Differences From the Previous Version
The previous analytics display was notably limited in both scope and functionality. While it provided basic engagement metrics, it lacked the depth and customization options now available. The new version offers a 300% increase in trackable metrics and introduces machine learning-powered insights that were entirely absent from the previous iteration.
Perhaps most significantly, the updated display makes analytics accessible to all users, not just those with professional accounts. This democratization of data means even casual users can make informed decisions about their content strategy. And unlike the previous version’s 28-day data limitation, the new analytics preserve your performance data for a full 90 days.
The post analytics update represents X’s commitment to helping creators and businesses maximize their platform impact. By understanding exactly how your audience interacts with your content, you can refine your approach, optimize your posting strategy, and achieve your social media goals with greater efficiency than ever before.